

Running and growing an ecommerce business entails making countless decisions, both big and small.
This can range from the color of your “Buy Now” button, the kind of products you ought to display in your store, to the major marketing campaigns expected to drive huge sales.
But where do you base these decisions?
Do you base your decisions or gut feel? Or do you look into the hard cold numbers?
In this guide, we’re going to share with you the essential metrics you need to keep track off so you can make data-driven decisions.
There are several metrics online sellers are advised to monitor, but below are five of the most essential metrics to diligently keep track of, so you can make data-driven decisions and grow your ecommerce venture.
1. Total Sales
When you monitor your total sales, you want to know when your sales went up, down, or the same on which period, and the patterns occurring in your sales performance over time.
Let’s look at a sales report by Shopify as an example.
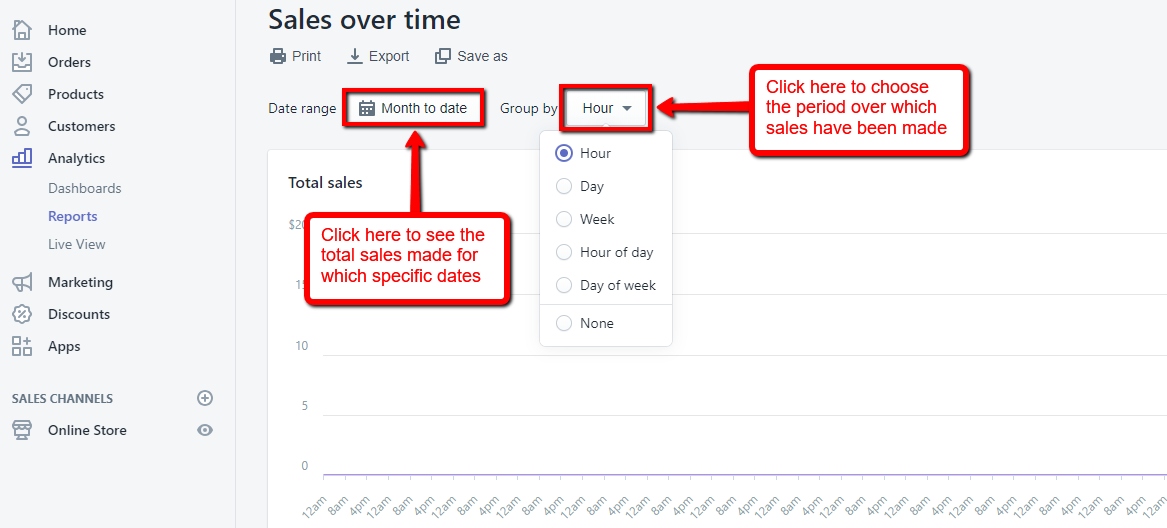
In the sales report, you can opt to see the figures based on the hour, day, or week of a particular sales period.
Notice the days when your sales were at the highest and the lowest, and on which days some patterns occurred.
Examine the possible reasons behind these occurrences. Knowing why your sales numbers are dipping, spiking, or staying the same can help you create more effective marketing campaigns.
You can augment low sales or further promote fast-selling products or services through email signatures, for example. You can even decide to do both.
2. Average Order Value
While it’s good to know how much sales you made overall, knowing how much you earn on average is hugely beneficial to make data-driven decisions.
Average Order Value (AOV) refers to the average amount of money a consumer spends per order.
Not only does this metric tell you how much revenue you made for every purchase, but it also helps you understand your consumers’ buying behavior. The information can greatly help your marketing decisions.
To calculate the AOV, divide your total revenue for a specific period by the total number of purchases for the same period:
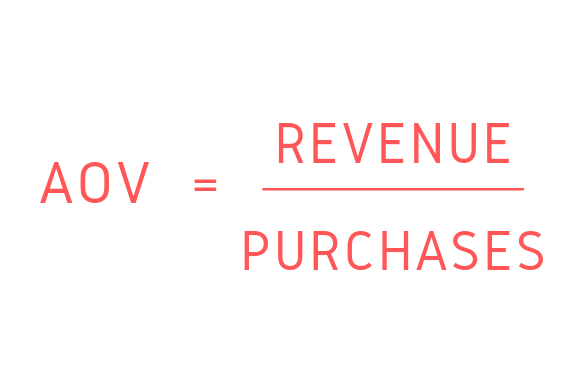
For example, if you generate a total revenue of $20,000 and a total of 980 purchases in June, then your AOV is $20.41.
In other words, one consumer spends an average of $20.41 for every purchase in the month of June.
(In case you’re having difficulty calculating your revenue, use this new, helpful tool called the Revenue Streams Graph.)
Now, how can this piece of data drive your decisions?
Knowing how much your consumers spend, on average, helps you make better pricing decisions, as well as how much to spend on online advertisements.
You should also know that an increasing AOV generally means a profit increase.
Boosting your AOV can distinctly ease your other strategies to increase revenue. It also implies that you are getting more value from the same amount spent to acquire customers.
3. Site Traffic
There are several tools for measuring site traffic available online. One of which is SimilarWeb.
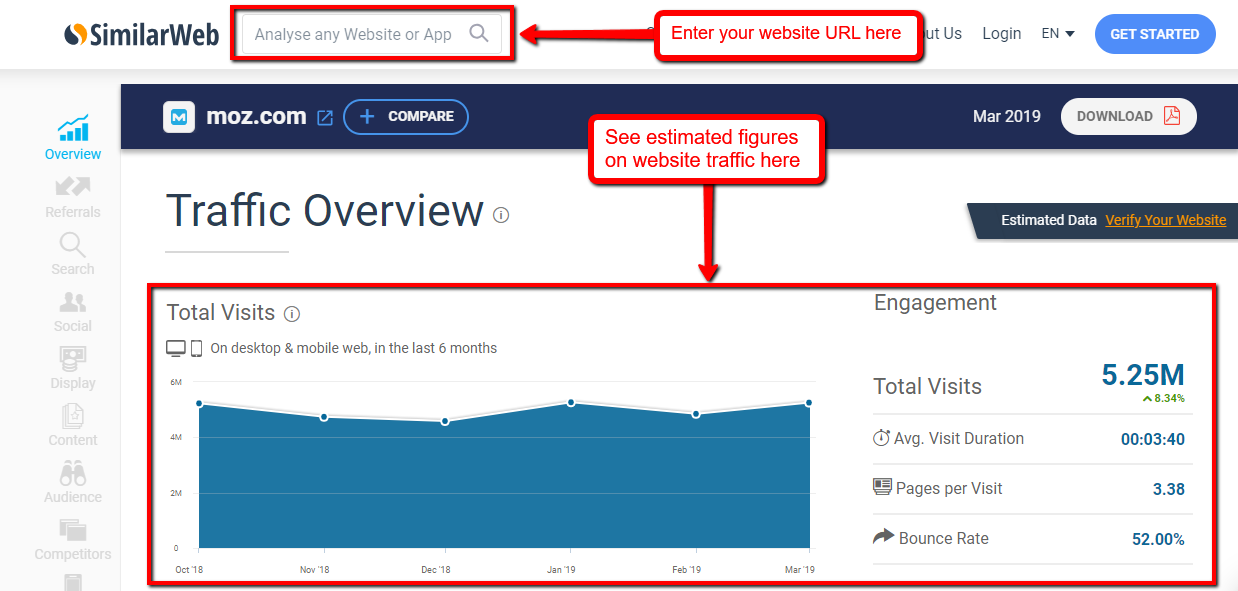
SimilarWeb displays estimated figures such as the total number of visits over a specific period and average visit duration, among many other data.
It shows the number of site visits, traffic sources, the months with the highest and lowest traffic by type of device, and the location of the majority of the visitors.
These numbers give you insight on which traffic sources are the most effective and can then guide you in your marketing and optimization strategies.
4. Conversion Rates
If you have successfully maintained a substantial amount of traffic on your website, that’s great.
But huge traffic is meaningless if your visitors are not “converting.”
Conversion rates refer to the percentage of site visitors who carry out your website’s desired action, such as making purchases, subscribing to your mailing list and product updates, or downloading your how-to guides, for example.
You need to monitor this metric to see how well you engage and persuade visitors to take action.
When monitoring conversions, you can further look at two aspects:
- Traffic source that gives you the most conversions. Is it search engines like Google or social media networks like Twitter?
This info can tell you the channels you must target and invest in to drive traffic or what to improve on in your messaging.
- Type of device, i.e., phablets or desktop.
If you notice that one device has regularly lower conversions than the other, evaluate that device’s user experience for what needs to be improved.
Specific web design attributes make your ecommerce site enticing, making it easier for visitors to convert.
Consider those attributes, particularly if your site’s mobile conversion rates are low because your visitors’ site experience may be seamless on desktop but annoying on mobile.
If this is the case for your ecommerce, then you need to create a mobile-friendly or responsive design for your site.
You should also consider if your content is compelling enough. Quality content is imperative to help increase conversions.
To help you develop quality content, you can tap freelance writers with a grasp of marketing and other qualities.
Remember that even minor improvements in conversions as a result of these changes can increase your revenue significantly.
To measure and learn how to optimize your conversion rate, you can use tools like Foxmetrics or do an A/B test.
5. Cart Abandonment Rate
Cart abandonment rate is the percentage of consumers adding items to their shopping carts but leaves without completing the purchase.
The reasons for cart abandonment include a complicated checkout process, no express shipping, or payment security concerns, etc.
A helpful tool for monitoring cart abandonment rate is Google Analytics. Simply go to Conversions > Ecommerce > Shopping Behavior.
To get even more practical insight out of this metric, monitor it alongside your conversion rate and AOV.
Now, what?
These five metrics are essential for any ecommerce business owner to monitor. But it’s not enough to check on them only once over a long period.
Regularly (monthly, at the least) monitor these metrics and you’re on your way to making data-driven decisions that can help you succeed in ecommerce.